2020 var det första helår där jag gick in i året med ett stort fokus på att själv ta hand om min aktieportfölj istället för att förlita mig på vänner eller krama index, efter att ha tagit tag i saken och blivit mer seriös under andra halvan av 2019. Efter att portföljen under brinnande pandemikrasch var ner drygt 40% som värst, vände allting under andra halvan och året slutade minst sagt i dur, med en avkastning om +56%, långt över alla relevanta jämförelseindex (men långt under många av de sanslösa avkastningar man matats med på Twitter senaste veckan).
Det hade varit väldigt lätt att slå sig för bröstet och intala sig själv att man gjort en fantastisk insats när jag lyckas nå denna fina avkastning under det första helår då jag själv arbetat mer aktivt med portföljen. Jag är dock av den åsikten att detta i mitt (och många andras) fall hade varit ett stort misstag, av flera anledningar. Dels gör jag inte särskilt många affärer på ett år, så att bedöma hur pass bra jag är som investerare på ett enstaka års utfall innebär att man bedömer mig på ett väldigt litet urval av affärer, men en ännu viktigare aspekt är att en väldigt stor del av min avkastning under året kommer från innehav som jag ägt sedan 2017 (Enlabs) respektive 2018 (Gravity), båda case där jag inte alls var delaktig i att göra grundjobbet utan förlitade mig på mina goda vänners kunskap och goda omdöme. Den i min mening absolut viktigaste aspekten, som jag upplever att många helt förbiser, är av mer övergripande och teoretisk natur, nämligen slumpens/turens inverkan på ens utfall över såpass kort tid som ett år faktiskt är.
Sannolikheter > determinism, Process > utfall,
Utfallet av en investering, precis som utfallet av en pokerhand eller en hockeymatch påverkas till stor del av slumpmässiga faktorer som ligger utanför utövarens kontroll. En pandemi kan slå till, ett dåligt riverkort kan komma på brädan, en domare kan döma absurda utvisningar åt ena lagets håll, etc. Vi människor är av evolutionen stöpta för att hela tiden leta efter mönster och dra kausala samband. När vi får ett utfall presenterat för oss skapar vi omedelbart och omedvetet ett kausalt samband. Y skedde därför att jag gjorde X. Vi är deterministiska till naturen.
I aktiviteter som till 100% påverkas av skicklighet är detta korrekt, men i alla aktiviteter där slump/tur har en stor påverkan på utfallet, kommer våra analyser att bli sanslöst dåliga. Vi drabbas väldigt lätt av ”hindsight bias”, alltså att vi, när vi väl vet utfallet, menar på att det var tvunget att bli så och att vi minsann hade kunnat säga det på förhand, eller rentav att vi sa det på förhand (även fast vi oftast inte gjorde det, så duktiga är vi människor på att vilseleda oss själva).
Istället måste vi se investeringar som ett spel om sannolikheter med en obegränsad mängt potentiella utfall. Låt oss ta Gravity som exempel. Bolaget har under 2020 släppt två stora titlar som båda initialt verkar vara succésläpp. Visst kan man på förhand försöka göra skaffa sig så mycket information som möjligt för att kunna göra en bedömning om hur framgångsrika dessa spel kommer att bli, men det är helt omöjligt att med säkerhet veta hur dessa spel kommer att tas emot, om servrar kommer palla trycket osv, på förhand. Utfallet av dessa spelsläpp har hittills blivit precis så bra som man hade kunnat hoppas på, utfallet har varit i den absoluta toppen av potentiella utfall, vilket också lett till att aktiekursen rusat under året. Att slå mig själv på bröstet och deklarera vilken fantastisk investerare jag är baserat på detta vore helt fel. Detta utfall är bara ett av ett obegränsat antal potentiella utfall som hade kunnat ske, så att bedöma min insats baserat på just detta utfall är en analysmetod som med säkerhet kommer leda till felaktiga slutsatser.
Som ett annat exempel kan vi ta Points International, ett bolag som säljer VIP-programspoäng, främst åt flygbolag och hotell, som jag ägde tidigt under 2020, och som jag sålde med förlust tidigt under pandemin. Var det ett dåligt beslut att investera i detta bolag? Kanske, kanske inte, men det är åtminstone enkelt att se att detta utfall, en global pandemi som lamslår hela resebranschen, är ett extremt utfall som inte hör till de vanligaste. Att kritisera min investering i bolaget baserat på just detta utfall är givetvis lika fel som att ta hela äran för min lyckade investering i Gravity. Det är otroligt viktigt att inse att man kan göra en dålig investering, men få ett fantastiskt utfall, precis som man kan göra en bra investering, men få ett riktigt uselt utfall. Gör man investering där man i 90% av fallen kommer att tjäna 100%, men i 10% av fallen förlora 100%, och utfallet råkar hamna i de negativa 10%, har man ändå gjort en otroligt bra investering som man kommer att tjäna mycket pengar på i längden. Vi måste tänka i sannolikheter, och inte i efterkonstruerade kausala samband.
Det är förhoppningsvis tydligt att vi därför inte kan utvärdera vår prestation som investerare baserat på utfallet i specifika affärer, och gör man inte särskilt många affärer tar det lång tid innan man får ihop ett tillräckligt stort urval för att med statistisk säkerhet kunna säga någonting om en investerares skicklighet. Hade man stoppat 100% av portföljen i EVO eller Tesla vid årets start hade man haft en sagolikt börsår med tresiffrig avkastning. Men är man en bra investerare?
Så om vi inte kan utvärdera vår insats baserat på utfall, hur kan vi då utvärdera vår insats överhuvudtaget? Svaret, enligt mig, är att fokusera intensivt på att utvärdera processen som ledde fram till investeringen. Vilken information hade jag tillgänglig när jag gjorde investeringen? I ljuset av denna information, tänkte jag på ett rimligt sätt och hade jag sannolikheterna på min sida? Gav jag någorlunda korrekta sannolikheter till de olika utfallen? Det är även här otroligt lätt att i efterhand påverkas av utfallet i sin analys och ge för stor sannolikhet till det utfall som faktiskt inträffade, och för små sannolikheter till de utfall som inte inträffade. Ett hjälpmedel mot detta kan vara att förlita sig på base rates, d.v.s. att utgå ifrån hur vanliga de olika utfallen faktiskt är om man tittar på en större population snarare än just det bolaget vi undersöker. Forskningen inom beteendeekonomin visar att vi människor lägger alldeles för stor vikt vid den specifika detaljerade informationen om just vårt fall, och för lite vikt vid de genomsnittliga sannolikheter som gäller för att något ska inträffa. Ett annat hjälpmedel kan vara att föra en noggrann dagbok över sina investeringsbeslut, både de bolag man undersöker och faktiskt investerar i, samt de bolag man undersöker och väljer att inte investera i. Jag försöker att för varje bolag jag tittar på avsluta med en kort sammanfattning om varför jag väljer att investera eller inte, och en ungefärlig riktkurs på vad jag tycker bolaget bör vara värt. Detta kan jag sedan gå tillbaka till och titta på i efterhand för att se hur processen såg ut just vid analystillfället. För varje uppdatering av riktkursen gör jag en ny sammanfattning som följer den tidigare så att jag kan följa min tankeprocess och hur mina antaganden förändras längs vägen.
”I know” vs ”I don´t know”
I ett avsnitt av Value After Hours (orkar inte leta upp vilket) som jag lyssnat på under året gjorde Jake Taylor en intressant distinktion mellan två typer av investerare, ”I know”-investerare och ”I don´t know”-investerare.
Investarere av typen ”I know” har stor tilltro till sin förmåga att se framtiden utspela sig och att hitta den stora framtida vinnaren, oavsett om det är makroekonomiska faktorer eller hur specifika branscher kommer att utvecklas. Dessa investerare tenderar att föredra tillväxtbolag där en stor del av vinsterna ligger långt fram i tiden, eftersom man litar på sin förmåga att pricka rätt vinnare.
Investerare av typen ”I don´t know” är mer skeptiska till sin egen (och i många fall även andras) förmåga att förutspå saker särskilt långt fram i tiden. Den här typen av investerare bettar mer sannolikt på ”status quo” i högre utsträckning, eller att saker ska förändras mindre än vad som allmänt förväntas i vissa branscher, och föredrar lägre värderingar där en större del av kassaflödena ligger i närtid och starka balansräkningar som utgör krockkudde.
Personligen tillhör jag definitivt kategorin ”I don´t know”. Detta är säkerligen delvis ett personlighetsdrag, delvis en effekt av att jag läst värdeinvesteringsböcker från och till i tio års tid, men framför allt en effekt av mitt yrke och mitt stora intresse för beteendeekonomi och prognoser. Som statistiker/dataanalytiker vet jag hur svårt det är att prognosticera med särskilt hög träffsäkerhet, och detta syns även tydligt i empiriska studier. Philip Tetlock, författaren bakom den fantastiska boken ”Superforecasting” har vigt sitt liv åt att studera prognoser, och hans slutsats är att alla prognoser som sträcker sig längre fram i tiden än fem år är helt utan värde. Fem år framåt i tiden eller mindre kan vi göra någorlunda ok förutsägelser men därefter är vi hopplöst usla. Det hjälper heller tyvärr inte om vi är experter på området, då experter tvärtom ofta är sämre på att prognosticera då de har för stor tilltro till sin egen förmåga och litar för mycket på den, istället för att, som tidigare nämnt, förlita sig mer på genomsnittliga sannolikheter för en större population.
Av dessa anledningar faller det sig naturligt för mig att leta efter investeringar med låga värderingar som kan räknas hem på kortare tid, eller branscher som är mer osannolika att förändras, där historiken är lång eller speciella branscher som av någon anledning har inslag av monopol eller oligopol. Om vi knyter an till sannolikhetstänket ovan föredrar jag självklart även investeringar där en större andel av de potentiella utfallen ger en acceptabel avkastning, vilket jag ser som en säkerhetsmarginal. Det finns antagligen bolag där ute som värderas till 20x Sales eller mer som kan komma att bli bra investeringar på sikt, men dessa kommer jag att missa, av just den anledningen att det krävs att dessa bolag träffar något av de sällsynta, riktigt bra utfallen för att så ska bli fallet, och så säker på min sak kommer jag i ljuset av den empiri som finns aldrig att vara på min egen förmåga att hitta just det bolag där inget kommer gå fel, för det har man inte råd med till dessa värderingar. En fråga många bör ställa sig som haft fantastiska resor i enskilda aktier som gjort 300% på ett eller ett par år, är vad som hade krävts för att få ett väldigt annorlunda utfall, och hur sannolikt det faktiskt var att något av dessa sämre utfall hade kunnat utspela sig?
Summering av året
Så hur summerar jag då mitt år? Självklart genom att titta på processen.
Det finns saker jag är nöjd med, som att jag aldrig övervägde att sälja av under raset med nån form av tanke att ”tima marknaden”. Även här är de empiriska studierna väldigt eniga i att det är helt omöjligt, så tror man att man är kapabel till detta lurar man antagligen sig själv å det grövsta. Jag är också nöjd med att jag hållit disciplinen och inte släppt på mina principer om värderingar, även om det stundtals varit lockande. Tack vare raset lyckades jag fiska upp ett bolag som jag länge haft på radarn men vars kurs jag inte tyckte gav tillräcklig säkerhetsmarginal innan kursen slaktades under pandemin, där är jag nöjd att jag inte fuskade och köpte trots en värdering som i mina ögon bara var lite för hög.
Det finns också saker jag är missnöjd med. En sådan är att jag under nämnda ras spenderade för mycket tid med att paniskt uppdatera flöden för att få senaste nyheterna, som inte gav någonting i investeringssyfte, istället för att lägga ner precis all tillgänglig tid på att försöka förstå och värdera några potentiellt högkvalitativa bolag som slaktades kursmässigt under raset. Det var tid som inte var väl spenderad och där jag garanterat hade högre timlön på annat håll.
Jag är även missnöjd med att jag vid ett tillfälle under raset brast i min disciplin kring att verkligen tycka att jag förstår de bolag jag äger. Jag köpte ett bolag som jag misstänkte var ett fint bolag vars kurs slaktats, men utan tillräcklig förståelse för hur branschen faktiskt fungerar. Detta insåg jag snabbt och sålde av innehavet bara efter några dagar utan att något förändrats i grunden för bolaget, till en förlust. Oavsett om jag hade gjort en vinst eller förlust i innehavet var processen dålig, eftersom jag anser mig ha för dålig kunskap om den branschen för att äga något bolag i den för tillfället. Jag är också rädd att jag, om kursen hade gått upp istället för ner under tiden jag ägde bolaget, inte hade sålt utan kanske rentav hade klappat mig själv på axeln för en bra affär. Hjärnan gör vad hjärnan gör 🙂
Slutligen vill jag poängtera att jag inte vet huruvida jag är en bra investerare eller inte. När jag väl skriver om bolag på den här bloggen är det inte för att ge råd, utan för att få input på mina tankar och resonemang för att ifrågasätta dessa och se om jag missat något i caset. Jag vet dock en del om att fatta beslut, och att utvärdera beslut som fattas med inkomplett information och där turen spelar en stor roll för utfallet. Detta är lärdomar som kan appliceras både på investeringar men även i ett gäng andra sammanhang, så förhoppningsvis känner ni läsare er ok med att ta till er de principerna, oavsett min förmåga som investerare.
Disclaimer: Informationen i denna text är inte att anse som någon form av investeringsråd utan är mina egna tankar och funderingar kring bolaget. Jag är inte en professionell investerare. Gör alltid din egen analys innan du köper eller säljer aktier. Jag äger för närvarande aktier i Catella och kan köpa/sälja aktier i bolaget utan att meddela bloggens läsare.
I fredags rapporterade Catella, ett av mina klart stökigare innehav. Varje gång jag sitter med bolaget är det samma visa, det känns krångligt, svårt och spretigt och min förståelse för verksamheterna är inte djup. Sen kommer man till värderingen och inser att det ser väldigt billigt ut.
Tf VD och storägare Johan Claesson skrädde inte orden under dagens conf. call utan var djupt kritisk mot prestationen inom flera av bolagets områden och hur avvecklingen av bankverksamheten skötts. Bolaget har ett riktigt svagt H1 bakom sig där Corporate Finance påverkats negativt av corona och Equity, Hedge and Fixed Income funds presterat osedvanligt uselt på fondsidan.
Trots motvinden har man dock gjort 111M i EBIT i de kvarvarande verksamheterna under H1 (dock inkl Mutual Funds som man kommer sälja 70% av under Q3), detta tack vare Property Investment Management som presterar mycket starkt för tillfället. Börsvärdet efter dagens tapp är 1.74 miljarder, man har en liten nettoskuld så låt säga 1.75md
EV. 2017-2019 var EBIT i kvarvarande verksamheterna 481, 440, 454 miljoner så va 460M i snitt, vilket ger EV/EBIT under 4. Det är sannolikt för aggressivt att förvänta sig EBIT på dessa nivåer framgent då man haft stora utflöden ur fonderna i Equity, Hedge & Fixed Income funds efter den svaga prestationen senaste året, samt sålt 70% av Mutual funds (som ingår i detta segment). Under H2 kommer man bokföra försäljningen av Grand Central vilket kommer ge en positiv effekt i bokföringen om 155M.
Verksamheterna är svårprognosticerade för mig, men Corporate Finance brukar alltid ha Q4 som överlägset starkaste kvartal, och man förväntar sig att en ännu större andel av affärerna än vanligt kommer att ske i Q4 i år jämfört med tidigare, och underförstått att Q3 kommer bli svagare än vanligt. YTD har man förlorat 16M på EBIT-nivå i denna del, 2019 gjorde man totalt 62M i EBIT varav 3M första halvåret. Förhoppningsvis är det inte aggressivt att tro att man kommer att göra ~10M EBIT för helåret.
PIM har haft ett mycket starkt H1 med EBIT på 117M att jämföra med 104M för helåret 2019. Däremot har denna del haft Q2 som överlägset starkaste kvartal de senaste åren, ifjol kom över 60% av EBIT under H1. Om vi säger att PIM gör 60M EBIT under H2 är det förhoppningsvis konservativt.
Equity, Hedge & Fixed Income funds har gjort 26M EBIT under H1 vs 181M under H1 2019. Fonderna har gått uselt med stora utflöden, och nu har man även sålt 70% av Mutual funds. Jag har ingen aning hur mycket pengar man kommer tjäna i denna del under H2, men sätter man den till 0 får man ändå en EBIT i H2 på 155M från försäljningen av Grand Central, 10M från Corpen och 60M från PIM (de två sistnämnda förhoppningsvis lågt räknat) = 225M. Adderar vi de 111M från H1 får vi 336M -> EV/EBIT drygt 5.
Blickar vi dessutom fram emot 2021 kommer avvecklingen av banken att slutföras, vilket kommer frigöra likvida medel om 350-400M. Under H2 2020 slutförs även försäljningen av Grand Central och försäljningen av Mutual funds, vilket tillsammans torde inbringa åtminstone 200M. Räknar vi slarvigt bort dessa likvider från dagens EV är vi nere i på runt 1.2 miljarder, att jämföra med historisk EBIT kring 460M och en EBIT för 2020 på 330M-ish. Vad EBIT kommer ligga på i framtiden är imo svårt att vara särskilt exakt kring, men även om framtida EBIT droppar till 250M betalar man ändå under 5x EBIT.
Det finns dock försvårande omständigheter kring att använda EV/EBIT som värderingsmetod. Kassan idag är över en miljard, men enligt Claesson ligger en stor del av dessa pengar i dotterbolag som behöver dessa av regleringsskäl, så dessa står inte moderbolaget fritt att förfoga för att exempelvis dela ut till ägarna. Han flaggar dock för att man kommer ha mer spelrum efter att pengarna från bankförsäljningen kommer in då dessa bör stå moderbolaget fritt att använda till vad man vill.
Dessutom har bolaget en ineffektiv skattestruktur där man av någon anledning som står över min kunskapsnivå verkar ha svårt att kvitta vinster och förluster i olika dotterbolag mot varandra på moderbolagsnivå. Konverteringen av EBIT -> nettovinst och i förlängningen andel av vinst som tillfaller moderbolagets ägare är därför lägre än normalt.
Vi kan även lägga till de faktum att det varit rejäl omsättning på ledningssidan senaste året. Inom loppet av ett par månader under slutet av 2019 sade både fd VD Knut Pedersen och fd CFO Marcus Holmstrand upp sig. Tf CFO Eva Bång satt på posten i dryga månaden innan hon sade upp sig. Nu har man äntligen knutit till sig en ny CFO, Christoffer Abramson, som kommer med ett starkt CV och en tydlig inriktning mot fastigheter. Någon ny VD har ännu inte presenterats, kanske vill Claesson själv styra skeppet tills han tycker att det åter befinner sig i rätt riktning?
Som sagt, det finns en hel del svårigheter med att analysera detta innehav, men när röken lägger sig under 2021 och bolagets verksamhet och inriktning mot fastigheter blir allt tydligare kommer vi ha ett kapitallätt bolag som handlas till mid single digit EV/EBIT, och då har jag inte ens nämnt de investeringar man gjort i fastighetsprojekt som förhoppningsvis är upptagna på BR till klart mindre än de kommer säljas för. För mig är det väldigt svårt att göra exakta prognoser på framtida intjäning vilket talar emot ett ägande, men för att få Catella att se dyrt ut får man göra extremt negativa antaganden om framtiden, alternativt att man tror att de försiggår något fuffens bakom kulisserna som har lett till den stora omsättningen på ledningspersoner. Caset har försämrats sedan jag först köpte i november 2019 på grund av den mycket svaga prestationen inom Equity, Hedge & Fixed income funds samt coronapandemin som gjort framtidsutsikterna mer osäkra i Corporate Finance-delen, men detta reflekteras även i kursen så enligt mina väldigt preliminära beräkningar anser jag att förväntad avkastning är ungefär samma nu som då, men kanske med något större variation i potentiellt utfall. Detta är dock min högst amatörmässiga bedömning och inget du som läsare bör lägga särskilt stor vikt vid alls.
Som sagt, ett innehav som kanske egentligen är lite för komplicerat för mig, men jag misstänker att det är just därför som möjligheten också uppstått. Intresset för bolaget är lågt med få analytiker som ställer frågor vid varje rapport, och kanske lite för struligt för många att analysera i en tid då alla letar compounders. P.g.a. komplexiteten finns det stor risk att jag både räknat eller tänkt fel i texten ovan, så uppmärksamma mig gärna om du märker några sådana. Jag tar tacksamt emot input på allt ovanstående, och om inlägget väckt ditt intresse för bolaget är det av yttersta vikt att du gör din egen research och inte förlitar dig på min då den riskerar att innehålla alla möjliga typer av felaktigheter i antaganden.
I ett avsnitt av podcasten Focused Compounding nämnde Geoff Gannon nyligen att investeringar i net nets troligen är den strategi som har starkast empiriskt stöd för att generera överavkastning jämfört med index av alla mekaniska strategier. Som statistiker/dataanalytiker triggade detta mitt intresse och fick mig att dyka ner i litteraturen på ämnet och se vad studierna faktiskt säger, och hur de utförts.
Vad är en net net?
Det som idag kallas för net nets definierades först av Benjamin Graham i ursprungsutgåvan av Security Analysis, utgiven år 1934. Den enklaste definitionen är att ta ett bolags omsättningstillgångar, dra bort samtliga skulder och preferensaktier, och sedan dela med antalet utestående aktier för att få NCAV, ”Net Current Asset Value” per aktie. Detta värde jämförs sedan med vad aktien handlas till, och Graham föreslår att köpa bolag vars P/NCAV understiger 0,66. Graham hade dock en något mer komplicerad uträkning för NCAV där han endast tillgodoräknade 75% av kundfordringar och 50% av inventarier i sin uträkning. Ett bolag som handlas till lägre än sitt NCAV per aktie handlas alltså till mindre än vad bolagets omsättningstillgångar är värda, efter att alla bolagets skulder dragits av. Uttryckt på ett annat sätt ger marknaden ett negativt värde till verksamheten i bolaget, och inget värde ges till eventuella materiella tillgångar.
Graham menade att ett bolag inte bör handlas till mindre än vad en ägare i bolaget skulle få i handen om bolaget likviderades idag, och att NCAV utgör ett bra estimat för vad detta belopp skulle vara. Likväl är det rimligt att tro att om bolaget i fråga såldes i en privat affär idag, så skulle priset aldrig understiga värdet på bolagets tillgångar, justerat för skulderna. Ett bolag som handlas till mindre än NCAV bör därför vara så nära vi kan vara på att vara säkra på att ett bolag är undervärderat idag.
Bolag som värderas till lägre än NCAV har i regel nån form av problem och kan i vissa fall rentav vara konkursmässiga, vilket reflekteras i de mycket dystra framtidsutsikter som marknaden ger ett företag med denna värdering. Grahams idé är att man genom att systematiskt köpa bolag för mindre än de är värda, och att NCAV är ett konservativt sätt att bedöma hur mycket ett bolag är värt, över tid kan hålla en hög avkastning. Graham själv har uppgett att han med höll över 20% i årlig avkastning under lång tid genom att investera i net nets. Under sin tidiga investeringskarriär ägnade sig även Warren Buffett åt investeringar i net nets med mycket gott resultat, enligt egen utsago över 50% om året, efter att ha formats av Graham i sin investeringsfilosofi. Även Walter Schloss, en annan lärljunge till Graham erhöll goda resultat genom att applicera denna strategi under lång tid.
Akademisk litteratur
I en studie av Oppenheimer från 1986 undersöker författaren hur Grahams NCAV-strategi skulle ha presterat i USA över perioden 1970-1983. NYSE, AMEX och OTC-börserna inkluderades samtliga i analysen. Aktierna köptes sista arbetsdagen i december varje år, och enbart aktier som handlades till 66% av NCAV ingick i portföljen, i linje med Grahams föreslagna strategi. Innehaven hölls sedan i 12 eller 30 månader. Innehaven viktades jämnt.
Strategin där man håller bolagen i 12 månader resulterade i en genomsnittlig månadsavkastning på 2,45% att jämföra med 0,96% för NYSE-AMEX index under perioden, och 1,75% för ”Small-Firm Index”. 10 000$ investerade i net net-strategin sista december 1970 hade i teorin förvandlats till 254 973$ den sista december 1983, en CAGR om 28,2%. Motsvarande summor för NYSE-AMEX och Small-Firm Index var 37 296$ och 101 992$. När man justerar för risk, vilket i vanlig ordning definieras som volatilitet i den akademiska litteraturen, minskar överavkastningen till 1,46% per månad jämfört med NYSE-AMEX och 0,67% per månad jämfört med Small-Firm Index. Detta indikerar att net net-strategin är mer volatil än ett brett marknadsindex. Strategin där bolagen hålls i 30 månader visar likartade resultat med tydlig överavkastning.
Studien visar även att det finns ett förhållande mellan hur liten andel av NCAV man betalar och framtida avkastning. Ju lägre P/NCAV, desto högre avkastning.
En studie från 2010 av Carlisle (samma Carlisle som idag har podcasten/fonden The Acquirers Multiple), Mohanty & Oxman tar vid där Oppenheimers studie slutade, och undersöker samma strategi med 12 månaders innehav för åren 1984-2008. Resultaten från denna studie är i linje med Oppenheim, då net net-strategin ger en genomsnittlig månadsavkastning på 2,55% att jämföra med 0,85% för NYSE-AMEX och 1,24% Small-Firm Index. Detta indikerar att net net-strategin överavkastar NYSE-AMEX index med 22,42% och Small-Firm Index med 16,9% årligen.
Även i denna studie testar författarna även att hålla innehaven i 30 månader, vilket ger en månatlig överavkastning om 2,56% för net net-portföljen, men med stor variation längs vägen.
När man delar in innehaven i portföljen i kvintiler baserat på hur stor andel av NCAV man betalade för aktien så får man i denna studie, till skillnad från Oppenheimer, resultatet att de billigaste innehaven faktiskt presterat sämst. Den andra kvintilen, d.v.s. de näst billigaste innehaven som grupp har däremot presterat bäst, därefter är ordningen linjär. Studien försöker även förklara överavkastningen med hjälp av andra konstaterade effekter såsom värdepremien, storlek på bolagen, momentum, likviditet m.m. Man konstaterar att överavkastningen inte kan förklaras bort genom att bolagen är ovanligt små, värdeeffekten, eller genom högre marknadsrisk. Likviditetspremien, att bolagen som ingår i strategin generellt har lägre likviditet än index, förklarar en viss del av överavkastningen, men långt ifrån hela. Författarna konstaterar även att strategin inte tycks ha presterat sämre med tiden för den period som undersökningen omfattar.
Redan 1981 genomförde den mycket kända investeraren och författaren Joel Greenblatt en studie på ämnet tillsammans med Richard Pzena och Bruce Newberg. Metodiken här var annorlunda. Man filtrerade till att börja med bort bolag med ett marknadsvärde under tre miljoner dollar, och tittade sedan enbart på aktier som börjar på bokstäverna A eller B för åren 1972-1978. Från dessa 750 kandidater som kvarstod bildade man fyra olika portföljer, där innehaven antingen handlades under NCAV, handlades under NCAV OCH hade ett PE mindre än 5, handlades under 85% av NCAV eller slutligen handlades under 85% av NCAV OCH hade ett PE under 5. Innehaven såldes efter en uppgång på 100%, eller efter två års tid. Innehaven var även här jämnt viktade.
Samtliga portföljer överavkastade index med råge, med årliga avkastningar mellan 20-42,2% före avgifter och skatt. Den portfölj som nådde hela 42,2% avkastning var den portfölj där bolag som både hade ett P/NCAV under 0,85 och ett PE under 5 ingick i portföljen. Det går dock att rikta viss kritik mot denna studie. Dels täcker den ett ganska kort tidsintervall, och dels är vissa av kraven för att inkludera bolag i en portfölj så strikta att antalet bolag i portföljen blir väldigt få, under vissa år var vissa portföljer inte ens investerade alls i marknaden. Detta är å andra sidan kanske mindre förvånande när man betänker att författarna enbart tittade på bolag vars namn började med A eller B och därmed hade ett klart mindre urval av aktier att välja från än vad som är fallet i praktiken.
En studie av Xiao & Arnold testar en net net-strategi på London Stock Exchange för åren 1981-2005. Här är kriteriet för att ingå i portföljen att NCAV / Marknadsvärdet för bolaget ska vara minst 1,5 vilket alternativt uttryckt ger ett P/NCAV < 0,5. Även i denna studie överavkastar strategin på ett sätt som inte kan förklaras genom kontrollerande variabler. Man provar i studien innehavsperioder om 1-5 år och testar både jämviktade portföljer samt marknadsviktade portföljer där ett innehavs vikt i portföljen står i relation till bolagets marknadsvärde. Den jämnviktade portföljen presterar bäst med årlig avkastning på över 31% i det fall då innehaven ombalanseras efter 12 månader, och 254% avkastning över fem år i det fall då innehaven hölls i just fem år, vilket motsvarar en CAGR om 20%.
An, Cheh, Kim fastslår i en studie som omfattar USA för åren 1999-2012 att net net-strategin tydligt överavkastar S&P 500, men med högre standardavvikelse. Avkastningen ligger runt 17-18% per år för de olika portföljerna. Denna studie visar även att strategin faktiskt går sämre än indexet i perioder då marknaden har negativ avkastning, men att detta kompenseras med råge av att strategin avkastar klart mer än indexet i perioder då marknaden går uppåt. Man föreslår därför en hedge-strategi för att begränsa volatiliteten, vilket ökar den totala avkastningen till 24-30% årligen för de olika portföljerna.
Det finns även en studie som jag inte har full tillgång till som visar att strategin överavkastar även på den japanska marknaden. Hur stor överavkastningen är och för vilka år detta gäller framgår ej av sammanfattningen i länken ovan.
Net nets har även undersökts i flertalet böcker. Enligt Victor Wendls bok ”The Net Current Asset Value Approach to Stock Investing” gav net nets en avkastning på 27,7% per för åren 1950-2009, de år portföljen var fullinvesterad. Här filtrerades så att bolagen behövde ha ett marknadsvärde på minst 30 miljoner dollar. James Montier skrev i boken ”Value Investing” att han uppnått en avkastning på 35% per mellan 1985-2007 för en global net net-strategi, och ovan nämnda Tobias Carlisle rapporterade i sin book ”Deep Value” att net nets gav en avkastning om 38,7% om året 1970-2013. Sammantaget är det empiriska stödet för att net nets i teorin ger en mycket god avkastning, framför allt på den amerikanska marknaden fram till 2012, mycket starkt.
En masteruppsats från Linnéuniversitet av Karlsson & Strand undersökte flera mekaniska investeringsstrategier på den svenska marknaden för åren 1998-2016, bland dessa net nets. Denna studie visar att net nets har underpresterat index i Sverige under denna period. Detta är dock i min mening en sanning med modifikation. När portföljerna byggdes varje år skulle dessa bestå av 10 innehav, lika viktade. I det fall då det inte fanns 10 net nets att fylla portföljen med i starten av ett år fylldes portföljen istället ut med den riskfria räntan. Om man exempelvis hade fyra net nets att tillgå bestod portföljen till 60% av den riskfria räntan. För år 2011 fanns ingen net net, varför hela portföljen bestod av riskfria räntan. För åren 1998, 2006, 2007, 2014, 2015 bestod portföljen av ett bolag och 90% riskfria räntan. Endast två år, 2003 och 2009, bestod portföljen av 10 net nets. Att på denna grund påstå att net nets underavkastar index är därmed inte korrekt, men det visar likväl på det faktum att det sannolikt är omöjligt att använda sig av en mekanisk net net-strategi om man begränsar sig till svenska bolag, då det helt enkelt inte finns tillräckligt många att tillgå.
Kritik
Att net nets som strategi fungerat historiskt är tydligt. Stödet är starkast i USA där flertalet olika perioder undersökts, men samtliga studier jag stött på som tittar på internationella marknader bekräftar att strategin tycks överavkasta även på dessa. På senare år tycks det dock som att net net-strategier, precis som övriga mekaniska värdestrategier, haft svårt att hålla jämna steg med marknaden, åtminstone på den amerikanska marknaden. Vad beror detta på, och hur sannolikt är det att denna trend kommer att bestå?
Som Evan Bleker skriver på sin sida netnethunter.com har detta delvis att göra med att en betydande andel av net nets på 2010-talet i USA har varit kinesiska bedrägier, och om man exkluderar dessa ser resultatet bättre ut för strategin. Med det sagt finns det även rimliga argument för varför det skulle vara svårare att genomföra strategin på ett lyckosamt sätt idag, då all information är mycket mer lättillgänglig för gemene man idag, vilket kan leda till att detta arbitrage inte längre är möjligt då det kan snappas upp snabbare av både robotar och en större pool manuella investerare som letar efter just dessa typer av bolag. Å andra sidan är det knappast net nets som fyller mitt Twitter-flöde om dagarna, och den typ av bolag som net net-portföljer i regel består av (små, illikvida bolag med tråkiga verksamheter och svaga resultat) är alltjämt den typ av bolag som många investerare skyr som pesten just på grund av dessa egenskaper. Strategin har också tenderat att fungera som allra bäst då marknaden varit på väg upp efter en svag period. Då vi bortsett från det dramatiska Corona-raset inte haft en längre nedgång på börsen på många år, är det inte alls omöjligt att strategin kommer att göra en stark comeback efter nästa stora svaga börsperiod. Detta talar i min mening för att strategin bör kunna fungera även framgent. Det finns även vissa anekdotiska bevis i form av Henning Hammar som under perioden 2016-06-30 – 2018-04-03 nådde en avkastning på 72% i sin net net-portfölj, och tidigare nämnda Evan Bleker som enligt egen utsago haft en CAGR på 22% i portföljen 2014-2019 enbart genom att investera i net nets (dock ej helt mekaniskt) som antyder att strategin alltjämt fungerar utanför USA.
Det finns även viss kritik kring metoden i studierna. Aswath Damodaran menar i en blogpost från 2010 att överavkastningen som flertalet mekaniska strategier uppnår i teorin via backtest inte skulle gå att replikera i verkligheten på grund av transaktionskostnader. Dels pekar han på courtagekostnaden som kommer att dra ned avkastningen (detta kontrolleras det dock för i flera av studier nämnda ovan), men en mer intressant poäng som är väldigt relevant i fallet med net nets handlar om spreaden mellan ”bid” och ”ask”. De flesta bolag i en net net -portfölj är små och illikvida. Ska man handla dessa är det inte alls omöjligt att man med sitt köp forcerar upp kursen något för att fylla sin position, och att man när det är dags att sälja trycker ner kursen något för att bli av med sitt innehav. Detta leder till en sämre avkastning än dessa teoretiska studier där man inte behöver köpa eller sälja innehaven i praktiken, utan bara använder de citerade kurserna för respektive köp/säljdag i analysen, indikerar. Denna kritik är i mitt tycke helt befogad och jag finner det sannolikt att praktiskt avkastning för dessa mekaniska strategier är något sämre i verkligheten. Det är dock svårt att veta exakt omfattning av denna effekt, och eftersom alla studier pekar på en årlig avkastning om minst 20%, ofta upp emot 30%, finns det gott om utrymme för dessa kostnader att påverka avkastningen utan att denna ska gå ner hela vägen till en marknadsmässig avkastning om 8-10%.
Ett mer praktiskt bekymmer för den gemene investeraren tror jag är volatiliteten. Det är genomgående i alla studier så att standardavvikelsen i net net-portföljerna är högre än för marknaden som helhet. Volatilitet är alltid svårt att hantera, och klarar man inte av att hantera de svängningar som strategin innebär finns en stor risk att man inte genomför strategin på ett bra sätt, utan ger upp längs vägen. Strategin kommer inte att överavkasta varje år, det kan (som det nu gjort i USA) gå flera år på raken där strategin inte levererar. Det är svårt att hålla fast vid en strategi som underpresterat i flera år, och detta problem är enligt mig den största svårigheten med att genomföra en net net-strategi i praktiken.
Sammanfattning
Resultaten från dessa studier tål sannerligen att tänkas på. Går det att uppnå 15-20% eller till och med 25% årlig avkastning med en mer eller mindre mekanisk strategi är detta ett mycket lockande alternativ, då väldigt få investerare lyckas hållas denna avkastning över tid. En nedsida är dock volatiliteten, som kommer att vara större än om man följer ett index. Nedgångar på 50% av portföljen kommer vara vanligare, och detta är något som är otroligt svårt att hantera normalt sett (vilket vissa av oss blev varse för bara några månader sedan), och kanske är det ännu svårare om han har en portfölj bestående av enbart mediokra bolag till ett riktigt bra pris. Det är lätt att tappa sin tro till även de starkaste bolag i de tuffaste mentala perioderna, och överger man sin strategi när det blåser som värst riskerar man sannolikt att gå miste om de allra mest lukrativa perioder som med denna strategi tycks följa de allra tyngsta perioderna. Ska man investera i net nets måste ha en stor tilltro till strategin, så att man även i de tyngsta perioder härdar ut och låter volatiliteten ha sin gång för att sedan skörda frukterna. Man måste även vara villig att investera utanför Sverige, då antalet net nets som dyker upp här är för få för att basera en investeringsstrategi på. För att hitta kvalitativa net nets, vilket möjligen kan få en att må lite bättre över sin portfölj i tuffare tider, behöver man sannolikt lägga ner en hel del jobb även på denna strategi för att hitta potentiella bolag i många olika länder världen över. Historisk avkastning är som alla vet ingen garant för framtida avkastning, men om det är så att strategin kommer att generera framtida avkastning ens i närheten av teoretiskt historisk, är det ändå svårt att föreställa sig ett enklare sätt att erhålla en riktigt bra avkastning.
Om du är intresserad av diskutera net nets eller har tillgång till fler studier som jag borde läsa och vill dela med dig av dessa, maila mig gärna på perplexedinvesting@gmail.com
This is just a very short post aimed at my miniscule group of readers that are from outside of Sweden. From now on, I will be writing in Swedish, as the vast majority of readers are from Sweden anyway. Going forward, I will try to write a little more often, and as such I will mix some more theoretical posts with regular reports on companies that I have researched in the past. My goal is to post once a week.
Disclaimer: The information provided in this post is not to be considered as any form of investment advice. I might buy or sell shares in any companies discussed in the post without notifying readers of the blog. I currently own shares in TGS-Nopec Geophysical Company.
I don´t think anyone even remotely interested in finance have missed what has happened with the oil price as a consequence of the drastic drop in demand due to the spread of the Corona virus, and the subsequent price war between Russia and Saudi Arabia. I will not go into details on that at all as I am no expert on oil by any means, and there is plenty of reading material out there on the subject if one wishes to get additional information on that subject.
However, I do like to be a little contrarian and look at things that people are avoiding at the moment, for one reason or another. As such, oil companies make for interesting hunting grounds having lost a significant portion of their market values in a short period of time. I would guess that the very best returns in the oil sector can be made if you identify levered companies that are valued as if they are going bankrupt but make it through, but since I have a preference for qualitative companies with strong balance sheet, that is not the route I have taken. Instead I will provide a brief overview of two companies with asset light business models and strong balance sheets that I think are attractively valued right now. This will not be in depth at all, and again, I am no export on oil so please do your own dilligence before buying anything I might have written about on the blog. I have no idea what the oil price will be in one month, six months, a year or even several years out, but I do think that the current oil price is unsustainably low, that the world will require oil for a long time to come, and that these two companies will be valued much higher when the oil price eventually regresses to a more normal level, with a very low probability of going bust in the interim.
TGS-Nopec Geophysical Company
This is a company listed on the Norwegian Oslo Exchange that I have owned for a long time, but that I have added to during the rapid fall in stock price from a high of over 280 NOK in mid December to around 138 NOK as I write this (it was tradig below 100 NOK at one point i March). TGS does not produce any oil, instead it collects, processes and provides seismic data to E&G companies. They are one of the leading global companies in the sphere with a multi-client business model where they collect the data once, and then sell the same data to several different clients. Generally, a decent portion of their revenues are pre-funded, meaning that the customer funds the exploration beforehand, reducing capital needs. The company does not own any vessels or crews for data gathering, instead they rent or do joint ventures with other companies that provides the vessels and crews. As a consequence, the fixed cost base is quite low and the company can be quite agile in crisis times like these and cut investment in the multi-client library quickly and remain cash flow positive.
Investments are continually made into growing the data library. Since the inception of new accounting rules in 2016, the library is being amortized aggressively, currently at a higher pace than new investments. As a consequence of this, the fact that a portion of the explorations are pre-funded by customers and the overall asset light, low fixed cost business model, the company generates a lot of cash flow compared to earnings. Free cash flow is typically higher than EPS. The company is free of debt and had net cash of abount 3 billion NOK at the end of Q4 2019. Free cash flow after investments in the multi-client library has been positive every year for as long as I have looked at the data in depth (2010).
During 2019, the company acquired Spectrum, another Norwegian company with a very similar business model but with a complementary data library, so to make reasonable predictions about the future, you need to look at the history of both companies and make some reasonable assumptions about future growth and potential synergies. Furthermore, the business is quite cyclical as customers investment behaviour with regards to new explorations are heavily influenced by the current oil price, so you need to use several years of data to estimate future earnings power, to get a sense of what the business will do over a full cycle. TGS has already warned that 2020 will be a challenging year, but thanks to their business model I still expect them to remain cash flow positive. Historically TGS has had a counter-cyclical investment policy where they invest more relative to peers in rough times for the industry to gain market share in the long-run. They have already announced a cut in investments in the multi-client library for FY2020 from 450 MUSD to 325 MUSD, which is still higher than the 250 MUSD that peers planned to spend on average before the Corona virus outbreak.
The company pays a quarterly dividend. They were planning to pay 0.375$ per share and quarter, but in light of recent events they decided to cut the next quarterly dividend to 0.125$ per share, and will evaluate the situation further going forward before deciding on what will happen to the divident for the rest of the year. They have historically also bought back stock continually, hopefully they felt confident enough to do so aggressively when the stock price plummeted in March. If not, I would have rather seen a complete suspension of the dividend in favor of buying back shares.
If we look briefly at valuation, EV should be around 13 billion NOK. Free cash flow defined as operating cash flow minus investments in the library for 2019 was about 2.1 billion NOK, and EBIT around 2.3 billion. These numbers only include Spectrum from the date the acquisition was closed in late August so on a full year basis were a bit higher for the combined entity. This gives multiples of EV/FCF2019 of a little over 6, and EV/EBIT2019 just under 6. Now, 2020 clearly wont resemble 2019, and judging a cyclical business on the results of a single year is probably not the best idea. Combining historical data for TGS and Spectrum with some assumptions on synergies based on what has been communicated, I end up with normalised FCF of around 1.6 billion NOK. This would give a EV/FCF of 13/1.6 = 8.125 or a a FCF-yield of over 12%. This might be a little aggressive given that 2020 will proably be quite weak, but given that I also expect the company to grow at maybe 3-4% a year over a full cycle I still think that a return of well over 10% seems very doable. If the stock price gets back to the December high (it has traded even higher previously) of 280 NOK in lets say five years, that would give a compounded annual return of almost 15% excluding any dividens or buybacks. This is certainly not the most explosive upside you can find in the industry, but it is a very safe company with a proven business model that generates a ton of cash. There are certainly risks here as in all businesses, but at least the risk of the stock going to 0 should be incredibly low.
Tethys Oil
I first started looking at Tethys in the fall, when it traded around levels of 80 SEK, and found it really cheap. Thankfully, for various reasons I didn´t pull the trigger, and now the stock has dropped to a price of around 47-48 SEK per share.
Tethys Oil is listed on the Stockholm Exchange in Sweden, is head quartered in Sweden and has a Swedish CEO. However, pretty much all of their revenue is generated in the sultanate of Oman. In fact, it is generated from one single source in Oman, namely their license to get a 30% production cut of the production in Blocks 3 & 4 in Oman. They are not the operator of the license, so they have very little tangible assets on the books. They do own a license in Block 49 in Oman where they are the operator and are currently about to start drilling for oil, but so far no commercial production has been commenced. The company also holds a share of the license in Block 56 where they are not the operator, and as in the case of Block 49, this has not generated any revenue to date.
Oman has historically been politically stable and has managed to stay out of any major wars despite their sensitive location. However, a quick search on Google makes it evident that human rights isn´t exactly on top of the agenda, and that the finances of the country are quite poor. To complicate things further, the government takes a share of all the production of oil in the country. In Tethys case, the license holders first get reimbursed for the costs of running the well. This is called cost oil. Any profits above costs are then shared beetween the government and the license holders. As far as I can tell, the budgets are made annually so Tethys share of output varies from year to year and could in theory vary all the way from 20% to 52% of the 30% of production that belongs to Tethys within their license. Historically though, Tethys share has been around 50-52% for most years, and they have guided towards a production share of 52% for FY2020. To date, Tethys seems to have had no problems at all operating in Oman and given that they are attaining more and more licenses in the country, they seem to have a good relationship with the state. That said, generating almost all revenue from a single license in a country located in a part of the world that has been very politically unstable for quite some time, with a leader that has absolute power of just about everything that goes on in the country, seems like something that deserves quite the risk premium.
So on to the numbers. For the last four years, Tethys share of production has been quite stable at around 2.2-2.3 million barrels of oil, so any differences that you might see in revenue is mostly due to volatility in the oil price. In 2019, with an average oil price of 64.2$, Tethys EBIT was 37.1 million USD which translates to about 374 million SEK. Average EBIT for the last three years is 45 million usd, for the last five years it´s around 32 million USD. In 2016, with an average oil price of 40.5$ they had negative EBIT of 0.4 million USD.
As I write this the stock price of about 48 gives a market cap of around 1.6 billion SEK. Tethys has no debt, and net cash of around 760 million SEK rendering an EV somewhere around 840 million SEK. EV/2019 EBIT is something silly like 2.4, EV/2019 FCF just over 3. So yeah, that’s incredibly cheap. If we use the five year average EBIT of roughly 320 million SEK we still get an EV/EBIT of less than 3.
As I mentioned, the company lost money in 2016 when the average oil price obtained was just over 40$. Cash flow was slightly positive. The company recently announced that they are taking measures to make sure they remain cash flow positive even at oil prices of 30$, so the risk of the company going bankrupt and the stock going to 0 should be incredibly small in this case as well. Clearly though, as is the case with TGS, in order for this bet to work out, oil prices need to revert to more normal historical levels eventually.
Tethys has historically returned a lot of capital to shareholders. In 2019 they paid an ordinairy dividend of 2 SEK and returned an additional 6 SEK per share through a mandatory redemption program. The plan was to do the same in 2020, but in light of recent events they have lowered the additional return to 3 SEK, while keeping the ordinariy dividend of 2 SEK, so 5 SEK in total will be returned to shareholders putting the ”dividend” yield above 10%.
As long as you believe that oil prices will eventually revery, then Tethys looks incredibly cheap, no matter how you slice or dice it. Still, I don´t own the stock. Why? Well, so far, I have had a hard time coming to terms with the geographical and political risk. Even though there have been no problems operating in Oman so far, and the country hasn’t been involved in any major conflicts yet, there is no guarantee that the same will hold true going forward. Also, any kind of force majeure event that could strike the region and wipe out production in the area would completely wipe out Tethys revenue along with it. Also, there is simply no way around the fact that the faith of Tethys is completely in the hands of the government of Oman, or more precisely, the sultan/chief of staff of armed forces/minister of defence/minister of foreign affairs/chairman of the central bank (yeah, it´s the same guy). Additionally, I don´t want to allocate to large of a portion of my portfolio into oil, and since I like TGS way better as a long term holding, that has been my choice in the sector so far.
That said, I am still interested in Tethys. First, I need to decide whether the risks described above makes the company uninvestable for me. If not, I need to figure out what price would make it worthwile to assume all these risks, which of course, is a function of the potential upside as well. A company with a single revenue generating asset like Tethys will probably never get any sort of premium valuation, as was evident in the share price even before this whole oil mess started. That said, even a defensive multiple of say 6 times normalised EBIT would generate a very nice return, as long as that normalised EBIT actually happens. For the sake of argument, if we assume that 2019 EBIT is a good approximation for a normalised EBIT, a 6 times EBIT multiple on that would indicate an upside of like 150% on todays stock price. Even if that takes five years to achieve, you´re looking at a 20% annual CAGR excluding any dividends.
As always, I greatly appreciate any feedback. This was not meant to be a deep dive in either company, but rather a brief pitch to provide you with two potential ideas to do further work on. Thank you for reading!
Disclaimer: The information provided in this post is not to be considered as any form of investment advice. I might buy or sell shares in any companies discussed in the post without notifying readers of the blog. I currently do not own shares in Points International.
It´s been quite some time since I last wrote something on this blog, about two and a half months in seems like. A lot has happened since, to say the least, and it actually feels like it´s been a lot longer.
First of all, I should probably mention that I have sold all my shares in Points International. It is hard to imagine a worse scenario playing out than what is happening right now for a company with massive exposure to the travel and hospitality sectors. When the company released it´s Q4 Earnings Report on March 4th, they reported that they had not yet seen a material impact from the COVID-19 virus outbreak, and that airlines historically in times of low passenger traffic had used other sources of revenue such as their loyalty programs to a larger extent to compensate for lost revenue. However, people just aren´t flying or even travelling right now unless it is absolutely necessary, and might not do so for quite some time, and over time I imagine that this has to hurt the business. This is obviously a temporary thing and not detrimental to the business long-term as they carry no debt, but I do fear that revenue will plunge to such an extent that they might end up having to buy loyalty points from their partners due to not reaching the annual guaranteed revenues that they give to their customers, which could change their balance sheet drastically if they were to assume debt and carry loyalty points on the balance sheet. Also, there is a real chance that airlines could go bankrupt and that Points lose business that way. I could very well be proven wrong, in which case I will tip my hat in respect to the company. If they actually manage to get through this without a severe drop in revenues, the company is way more resilient than I thought and I would be more interested than ever in owning the company. I do continue to the follow Points with great interest, and might certainly own it again the future, depending on the outcome of this crazy situation.
I don´t regret buying Points, and I do not regret selling it either. Sometimes, a low probability event that smash your thesis to bits occurs, in which case you just have to accept it and move on. That does not have to mean that your initial analysis was wrong or that you made a bet with a negative expected value. I could have probably been a little bit quicker in reacting, but overall I don´t have any major problems with how I handled the situation with Points.
I try to reflect on how I´ve handled this very tumultuous time in the market overall, and learn from it. Given that I´ve played poker for a living for many years, I´m probably more used to daily swings and losing money than most people, but I have to admit that it still hurts to see you portfolio drop 30+% in a very short period of time, even though I am well aware that in a lifetime of investing, this is likely to happen many times, and that we might still be far from reaching a bottom. It is very easy to let your emotions get the best of you and make irrational decisions, that are likely to mimic the emotional behaviour of the rest of the market, i.e. selling what everyone else is selling at the same time, and buying what everyone else is buying at the same time, or not buying at all. I don´t think that I have panicked during this crisis, but I might have made a decision or two that was a bit rushed, buying into something where I wasn´t really done analysing it because the price dropped by a lot in a short period of time, without really knowing what I estimated it´s intrinsic value to be. Hopefully I will learn from this and not repeat that same mistake in the future. Having patience and the ability to keep calm and rational is incredibly important, and something else I have learned about myself during this very volatile period in the market is that conviction in your holdings is crucial. If I feel confident that the value of the company is greater than the current price and that the business will be fine long-term, it just makes it so much easier to ignore the current share price as well as other random noise, and focus on what is important.
My overall strategy remains the same. I do not believe in timing the market, as there is ample empirical evidence that shows that this is a fools errand. Since I don´t plan to use the money that I have invested in the stock market for a long time, and I feel very good about the chances of all my holdings compounding at a rate of well above 10% for the years to come, I remain more or less fully invested. As I write this I happen to have some cash lying around from selling Points, but it will put to use as soon as I find a case that I feel confident about. But learning from previous mistakes made, I try not to rush it. I´m sure there will be many great opportunities going forward and as I mentioned above, I really want real conviction when buying into a new business.
I see a lot of people discussing macro stuff and selling of or hedging in my social media feeds. Some of it probably has to do with people using very different strategies from mine, but as far as I can tell, a lot of it is also driven by fear and the notion that one can know perfectly well when to enter or exit the market. The number of tweets I have read with people saying that they are ”waiting until things have settled down to get back in” are probably in the hundreds. The problem is that we will never know when things have settled down, or when the market has bottomed. If nothing else, the volatility from the last month goes to show how incredibly fast markets moves these days, and once things start to look better across the world, the market might be very quick to react. Or they might not. Thats the point. We just dont know. And honestly, who really knows the implications this whole thing will have on the economies across the globe? I sure don´t. I have no opinion as to whether we´ve bottomed out now, or whether it will take five years to do so. What I do feel confident about, is that if I left my portfolio untouched for ten years, it will be worth a lot more by that time, or at least some time during this 10-year period. With my time horizon, I would also guess that now is likely a better time to buy stocks than six months ago, as (some) valuations have come down quite a bit. Since I try to stay fully invested at all times (provided I have enough ideas) that part isn´t as important to me, but it is something to keep in mind if owning stocks right now feels awkward. Even with a 3-7 year holding period, the price you pay affects your return quite a bit, and even if future prospects have become significantly worse (and hard to perfectly determine) for some companies, there are also companies out there that have become a lot cheaper without this whole episde changing their outlook much, or in some cases not at all.
Investing in volatile times is emotionally hard, but I honestly feel that it is in times like these that you can actually add a lot of value by not being caught up in the market panic, and to instead stay calm and rational. I also think that since these instances are (thankfully) rare, you have to take the opportunity to really try and learn from them, and this is the key, without being short-sighted or results oriented. I have certainly learned a ton about how markets function in times of crisis, and maybe even more so, how I function in times of crisis. I hope that will pay off for many years to come.
Disclaimer: The information provided in this post is not to be considered as any form of investment advice. I might buy or sell shares in any companies discussed in the post without notifying readers of the blog. I currently own shares in Points International.
My latest position is in Points International, a Canadian company providing e-commerce and technology solutions to the loyalty industry headquartered in Toronto, trading both on the Toronto Stock Exchange (ticker PTS) and on the NASDAQ stock exchange in the US (ticker PCOM). Over 90% of the daily trading volume happens in the US. Market cap is around 200MUSD and the annual share turnover is roughly 80%. It is a small/micro-cap company that is fairly illiquid, and thus might have potential to be overlooked by the overall market.
BUSINESS
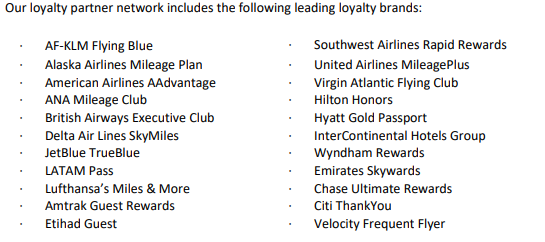
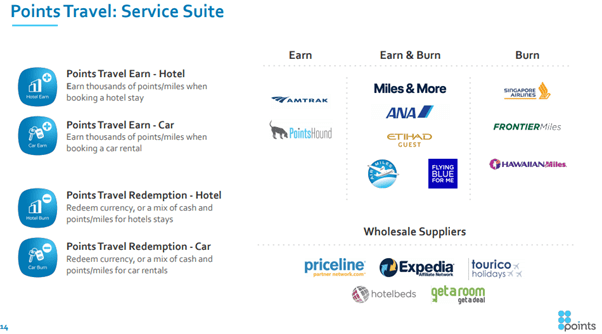
It is not entirely straightforward to figure out exactly what it is Points does exactly. Citing the companies filings, they are the “..global leader in providing loyalty e-commerce and technology solutions to the loyalty industry, connecting loyalty programs, 3rd party brands and end consumers across a global transaction platform.” Points do not run their own loyalty programs, and they do not provide the technology to operate such a program. Instead, they have build a “Loyalty Commerce Platform” (LCP) that loyalty programs and third parties can use for transaction capabilities, program integration, analytics, reporting, security and fraud detection. The products and services offered by Points are designed to increase loyalty programs revenue and profits by selling loyalty program currency or related services to end consumers or third parties, drive efficient cost management by offering “non-core redemptions” and to enhance loyalty program member engagement. In short, Points partner up with loyalty programs and help them make more money through the use of their platform. Points have direct integrations with over 60 loyalty programs, with the majority belonging to the airline or hospitality space. The total number of loyalty program member accounts in the network of loyalty programs integrated with Points is over 1 billion. The loyalty industry as a whole is growing rapidly with the number of annual memberships up 15% a year (according to Points investors presentation). 60% of points/miles acquired in a year is estimated to be bought by 3rd parties such as Points. Below is a snippet from the annual report showing some of the major loyalty partners.
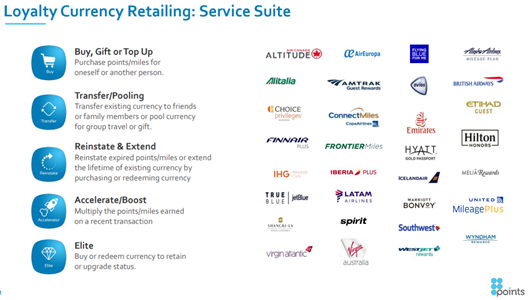
The company operates three different business segments. The, by far, biggest contributor of revenue (and pretty much entire contributor to profits) is the “Loyalty Currency Retailing” (LCR) segment. This segment consists of products and services to buy loyalty program currency for personal use or to give away as a gift, purchase status points to reach a tier status, transfer points to another member etc. In this segment, Points has 30 loyalty program partners that use at least one of the solutions within this segment, all within airline or hospitality. In this segment, Points primarily compete with the internal technology departments of the loyalty programs, but claims to have been successful in acquiring customers that previously provided the same services in house. Two thirds of the revenue within this segment comes from deals where Points technically acts as a “principal”, selling loyalty points at a retail price that they purchase at wholesale price from their partners. However, an important distinction needs to be made. Points do not load up on loyalty program points and keep them on the balance sheet. On the contrary, using the LCP, Points can buy the loyalty points in real time from their partner as they sell them to the end consumer. Importantly, Points get paid by the end consumer immediately and will have the money in their account within a few days, whereas the payments to loyalty partners are done on a monthly basis, usually 30 days after the end of the month in which a transaction was made. This leads to Points having “float”, usually with 1.5-2 months of revenue sitting on the balance sheet in cash at most times in payables to loyalty partners. Since Points seem to have very stable revenue streams from this segment, this float is essentially a free loan from the loyalty partners that pretty much funds Points operations and has enabled Points to grow without requiring any additional capital. Growth is essentially free for Points thanks to this.
The revenue where Points acts as a “principal” is booked on a gross basis. If someone buys 10 000 loyalty points through Points for 300$, but Points then passes 250$ along to the loyalty partner, the entire purchase amount of 300$ is booked as revenue, and 50$ becomes the gross profit on the transaction. For most other revenue within the business, what is booked as revenue is actually the commission that Points charges on transactions where they act as an agent or platform provider, on a net basis. Because of this, revenue isn´t a great measure to use when evaluating the company as a large chunk of that revenue is being passed along to loyalty partners and doesn´t belong to Points, though it is still crucial in generating the float that funds the operation. Gross profit is a better number as it is more indicative of the money earned by Points that will actually stay with the company permanently, it is essentially the “real” revenue for the business. Because of the way revenue is booked in this segment, the gross margin is quite low at around 12%.
In 2018, almost 98% of total revenue was generated in the LCR segment, and over 100% of operating profits. In the LCR segment, Points actually guarantees annual revenue to some of their major partners. For instance, in 2020, Points has guarantees to various partners to sell at least 150 MUSD worth of loyalty points in total. If they do not manage to do this, they will have to buy the loyalty points themselves from the partners, creating a potential liquidity risk. Revenue in this segment is likely to end up somewhere between 350-400 MUSD in 2019, so the total liability isn´t that great in comparison to total revenue. These liabilities are very likely to be spread out over several partners, so even though Points revenue in total is likely to stay way above the guaranteed 150 MUSD, they may still miss the guaranteed revenue targets for a particular partner and be forced to buy loyalty points from this particular partner by the end of the year. As far as I can tell from the annual reports, this has only happened once in the last ten years or so.
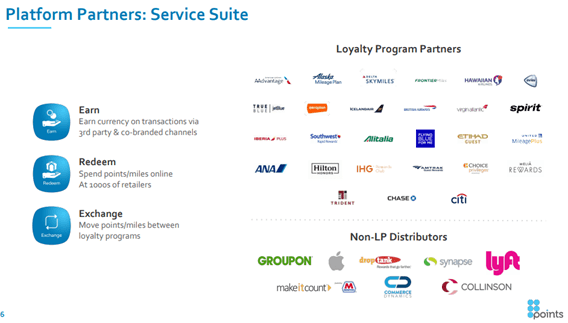
The other two segments are “Platform partners” and “Points Travel”. In the “Platform partners” segment, Points allows loyalty programs, merchants and other consumer service applications to use the LCP to distribute loyalty currency and loyalty commerce through multiple channels. Several third party applications are enabled by the LCP. They range from redemption based services that offer cost management solutions to loyalty partners, to earn-based services where merchants can partner with Points to buy loyalty currency to offer to their customers as awards. The revenue in this segment comes from commission fees, a set fee per transaction, revenue sharing or monthly recurring revenues, and gross margins are generally very high. In 2018 the segment generated revenues of just under 8 MUSD and a gross profit of 7.4 MUSD, with an operating result around 3.8 MUSD. I expect similar numbers in 2019.
The “Points Travel” segment is a white-label online travel service specifically designed for loyalty programs. Here, Points partner up with loyalty programs to enable members of the loyalty program to easily earn and redeem loyalty points by making hotel or car reservations online. By year end 2018, Points had 12 partners using at least one of their services in this segment generating a total of 1.8 MUSD in revenue (mostly from commissions) and an operating loss of 3.8 MUSD. The competition is fierce within this segment, as major online travel agencies are among the competitors. The development of this segment has been slower than anticipated by management, but according to a recent earnings call, the economics for the partners are great in this segment, as well as the unit economics for Points.
The contribution of “Platform partners” and “Points Travel” to the bottom line is very close to 0 for the time being, but even if they aren´t adding profits on their own, they might still be very useful. As mentioned, Points have a total of 60 loyalty partners, and offers a wide range of products and services within each segment. Whenever a new partner is signed, they usually just sign up for one or a few of the products that Points offers. Points then works on up-selling and cross-selling additional products and services to partners over time. If I´m reading correctly between the lines, both these segments, and maybe “Points Travel” in particular, is a great way to establish a relationship with a new partner that can be expanded over time. According the investor presentation, the current “opportunity matrix” within existing partners is only 30% penetrated, leaving ample space to grow with existing partners as well as new ones.
In December 2018, Points signed a strategic partnership with Amadeus IT, a giant IT provider for the global travel and tourism industry. Amadeus offers pretty much everything you can image, including loyalty programs, to airlines, airports, tour operators, insurers, ferry and cruise lines, travel agencies etc, and had revenues of almost 5 billion Euros in 2018. Citing the press release, the partnership “… will enable airlines to integrate Points’ solutions within existing Amadeus Loyalty Management and Awards solutions at the click of a button.” Amadeus have relationships with over 150 airlines across the globe, so if things turn out well, this could be a major driver of growth in the future, as Points look leverage Amadeus’ global presence and co-develop new services with them.
FINANCIALS
The financial results of the business has been pretty spectacular in the past. Revenue has gone up every single year since at least 2008 (this is the earliest year I have gathered data on), indicating that more and more loyalty points are being sold through the company every year. Adjusting for a one-time non-cash write down on a JV investment in China, gross profit has increased every year as well. EBITDA increased every year up until 2016 and 2017 when it decreased for two years straight, before increasing rapidly to record levels in 2018 with the company on track for another record year in 2019.
Looking back over the five year period of 2013-2018, gross profit has compounded at an annual growth rate of 10%, EBITDA at 14% and the companies favourite measure, Adjusted EBITDA at 16%. However, the company has bought back shares consistently since 2014, generating even greater growth rates per share with gross profit per share compounding at 21% annually for the period, EBITDA at 27% per share, and Adjusted EBITDA at 33%. If we look the period 2015-2018 instead, growth has been quite a bit slower with gross profit per share compounding at 11% annually, EBITDA 11% and Adjusted EBITDA 17%.
The business is generating a lot cash. In fact, it is one of the rare type of businesses that consistently generate more cash flow than earnings. Average after tax profit in 2013-2018 was 4.9MUSD. Average free cash flow (defined as operating free cash flow – all cash expenses for acquisitions of property & equipment and additions to intangible assets, as well as cash costs for the Restricted Share Unit-program) over the same period was 11.9MUSD. For the period 2015-2018, average after tax profit was 4.9 MUSD, and average FCF 11 MUSD. For the period 2013-2018, total after tax profits were 28.1 MUSD, total FCF was almost 60 MUSD.
The company achieved all of the above without carrying any interest bearing debt at all during any of the years I have data on, and they still don´t.
2019 is on track to become a record year in terms of both gross profit and adjusted EBITDA. Management has guided for gross profit to be between 58.5-64.5 MUSD which would mean 9-20% growth YoY, and adjusted EBITDA between 20.5-23.5 MUSD which would equal somewhere between 10-26% growth YoY. Additionally, during the year, the company announced long term goals of generating gross profits in the high-90 million dollar range by 2022, as well as more than doubling adjusted EBITDA to the mid 40-million dollar range. This is the first time that management has gone public with long term goals as far as I can tell.
MOAT
The financial performance of the company certainly seems to indicate some sort of moat. On a recent earnings call, one of the few analysts covering the call asked whether the company experienced any change in the competitive client regarding the LCR segment. Management reiterated that they did not, and that they mainly compete with the internal technology departments of their loyalty partners. For some reason, Points has managed to increase profits pretty much for 10 years straight, without seeing their returns competed away. Why is this?
If we consider the situation from an airlines point of view, they want to sell as many points as possible as rewarding and selling points has turned out to be a very lucrative business. Loyalty programs increases customer retention rates, which leads to a higher Lifetime Value (LTV) per customer. The more you can engage your customer, the higher the LTV over time. This has triggered loyalty programs to come up with new ways to generate revenue, for instance by offering members the opportunity to rent cars or make hotel reservations using their loyalty currency. So airlines wants to drive revenue in this segment, and they are faced with the choice of either building a product in-house and do all of the marketing themselves, or they could hire Points to do it for them. If they choose to build their own products to try and drive revenue, they are going to have to employ both capital and man hours to do so, with no guaranteed return on the investment. If they instead hire Points, they have no costs associated with this, and are instead guaranteed a steady stream of revenue as well as access to Points growing network of loyalty partners in other industries, primarily in hospitality.
Additionally, Points have access to transactional data and anonymized customer data from many different loyalty programs in the same industry. Without knowing for sure, I think it is reasonable to assume that this is an advantage when it comes to marketing as they should have more information to use to optimize any marketing efforts and generate a higher return on the investment than a single airline would on its own.
There´s also a scale component. An airline would have to spend X dollars to develop the products on their and market them. Points probably have to spend a similar amount, though I´m assuming the number is bigger for Points due to the fact that their customers might have different needs and requests, but they can then derive revenue from many different clients using the same technology, whereas the airlines would only derive revenue within their own loyalty program.
Lastly, there´s probably some network effects going on here. Points have established relationships with many partners in different sectors that an airline (or any other loyalty program) will get access to by partnering up with Points, meaning they don´t have to spend any time or money developing those relationships themselves. Developing new ways to earn or redeem loyalty currency is crucial to drive customer engagement, and getting access to Points network of merchants is a quick way of doing this. As an example of how this can work in practice, during the year Points signed a deal with Home Chef, one of the largest meal kit delivery companies in the U.S, that enables United Airlines loyalty program members to earn frequent flyer miles when they sign up for Home Chef. This way, Points benefits from any additional engagement from United’s loyalty members by selling more loyalty currency, as well as a commission from Home Chef whenever someone signs up using United miles.
Another example is the possibility for members of the Hilton Honors loyalty program to use their loyalty currency to pay for their Lyft rides, by leveraging Points LCP platform.
I am not sure quite how wide Points moat is. In theory, airlines and other loyalty programs might certainly in-house this type of products, but since Points generate more revenue and sign up more partners year after year, the trend seems to be the exact opposite. In theory, companies such as Amadeus with a massive network of partners in the airline industry and lots of resources that already run loyalty programs could easily build their own product to compete, but they didn´t. Instead they signed a partnership with Points. Other marketing businesses or transaction platforms could also be a potential threat, but the type of relationships Points has would probably take some time and resources to replicate, and it might not be worth it to an outside competitor as it is a very niche business. Really, it´s more like a part of the business of running a loyalty program, that Points has specialized in running on behalf of loyalty programs. Overall, it´s probably not the widest moat I´ve ever seen, but there are no signs at all that it is eroding at the moment.
MANAGEMENT & CAPITAL ALLOCATION
Management has generally been with the company for a long time. President Christopher Barnard and CEO Robert MacLean are both co-founders and have been in charge throughout the very successful history of the company, or at least as far back as I have gone in my research. While it is very nice to see continuity and a founder-led company by seemingly competent people, this makes the fact that insider ownership is quite low all the more puzzling. Barnard and MacLean owns just over 200 000 shares each, or approximately 1.5% each of the shares outstanding and are still the biggest shareholders of the board or management.
Since 2017, executives no longer gets cash bonuses. Instead, their entire bonus is paid out in stocks in a “Restricted Share Unit”-program. Rather than diluting shareholders, the company has decided to appoint a trustee to administer the program and purchase shares from the open market that are then passed on to management as bonuses. This creates a very real and recurring cash expense but keeps the number of outstanding shares lower, and should increase insider ownership over time. If you look at recent insider transactions, you see a lot of selling and not much buying. This probably is partly due to the fact that no one is given cash bonuses, so if you want any cash other than the base salary as an executive, you need to sell shares. With that said, if the company truly is reaching an inflection as management has said, it would be very comforting to see them load up on stock and put their money where their mouth is, or at least not sell any of the stock that is handed to them in bonuses.
Management is not exactly conservative in their communication. The adjusted EBITDA used definitely include some things I consider real expenses that impacts cash flow, particularly equity-settled share-based payments, and the language in general is very bullish. The company gives guidance for each fiscal year, and the measures used in guidance have varied a little from year to year in the past, though they have remained the same since 2017 at this point (gross profit and adjusted EBITDA). The definition for adjusted EBITDA was changed in 2016 in a way that, surprise surprise, rendered a larger number, as the equity-settled share-based payments has been added back to net income (along with all the usual EBITDA adjustments) since. Since 2013, they have had to revise their guidance of adjusted EBITDA downwards once (in 2016) and up twice (in 2018 and 2019). The combination of very bullish commentary alongside low insider ownership is a bit weird to me, if they truly believed in what they are communicating, why wouldn´t the executives (especially the co-founders) want to own more stock?
With regards to capital allocation, the company has never paid a dividend, and they don´t intend to in the near future. Instead, they have been aggressively buying back stock through a “Normal-Course Issuer Bid”, a Canadian term for a company repurchasing its own stock from the public in order to cancel it. The NCIB needs to be approved by the TSX yearly, and the company has the authority to buy back up to 5% of the shares outstanding in 2019, and did so in 2018 as well. Since 2014, shares outstanding has gone from 15.4 million to 13.5 million, a total reduction of 12%, or -2.6% compounded annually, with the pace of the buybacks picking up in recent years. The buybacks are perhaps a bit too automatic for my liking, as I like to see management being very opportunistic in their allocation of capital, but given how cheap the stocks been historically, I think buybacks have been a fine option. At the very least, it is perfectly in line with management being bullish on the future of the company.
The company has made two acquisitions in the last five years, the most notable one being the acquisition of Accruity Inc, the operator of the PointsHound hotel booking service in 2014 that seems to have cost 16MUSD judging by the cash flow statement. The services in the “Points Travel” segment has been built upon the PointsHound technology, and with the segment still showing negative earnings, this investment isn´t looking to hot today.
Overall, any concerns I might have regarding management is more of a gut feel regarding low ownership and non-conservative commentary, rather than anything that is evident in the quality of the business, that by all measures, seems very high.
GROWTH
Compounded annual growth rates are lower across the board if you look at the 2015-2018 period vs the 2013-2018 period, and even lower still compared to the 2008-2018 period. So growth has slowed down, but it seems like it could be picking up again in 2019, and for managements long term goals to be met, it has to pick up quite a bit. The company has identified three core growth drivers going forward:
Sign new partnerships
Up/Cross-Sell Existing Partnerships
Drive growth in existing partnerships
These are all self-explanatory. Furthermore, the company has also identified three growth accelerators:
Geographic expansion
New verticals (financial services and retail mentioned in investor presentation)
Corporate development (by acquisitions and strategic partnerships).
The majority of revenue is coming from North America and Europe today. Here, growth is expected to mainly come from cross-selling existing partners and moving into new verticals, with financial services (the company has existing partnerships with Chase & Citibank) and retail being the primary targets. According to the investor presentation, the company has a growing footprint in the Middle East and are targeting large carriers and financial services in that area. The same is true for South America and the APAC region, and in H2 2019 Points has opened a new office in Singapore to better serve this region.
Regarding acquisitions, the investor presentation states that the historical approach has been opportunistic, but that the company is moving to a more proactive approach given balance sheet strength. Personally, I´m not sure I´d like to see any acquisitions at all given the history with PointsHound and how well the core business is doing.
The strategic partnership with Amadeus could present a great opportunity for growth as it should enable Points to establish relationships with new potential partners that are currently customers of Amadeus. During 2019 Points have added a couple of new partners through the partnership with Amadeus, but the extent to which this had affected overall gross profit is unclear.
VALUE
So we have a seemingly very predictable, profitable business carrying no debt that throws off a lot of cash. Market cap as I´m writing this is 199MUSD and the company had 54MUSD in cash at the end of Q3, with another 6MUSD expected to be paid back from the tax authorities in Q4, rendering an EV of 139MUSD. If we expect that adjusted EBITDA for 2019 will be in the middle of guidance at 21.5MUSD, and that my definition of EBITDA will be 16.5MUSD (subtracting equity-settled share based payments) we get an EV/EBITDA of 8.4. The company has actually generated more cash flow than EBITDA historically, but that does not seem to be the case in 2019. Using my definition of FCF and looking at the average for 2015-2018 to even the lumpiness of free cash flow out a bit, we get 11MUSD in FCF and an EV/FCF multiple of 12.6 or a FCF yield of 8%.
Using enterprise value might be a bit optimistic, as an outside buyer of the company wouldn´t be able to just pocket the cash that is sitting on the balance sheet as it is going to be paid to partners. If we look at P/FCF instead (adjusting for the 6MUSD tax rebate), we get a multiple of 17.5 and a 6% FCF yield. This is very conservative measure as I exclude the expected record year of 2019 in the calculation of free cash flow, and give no value to the cash on hand. To exceed the average market return over time, we need growth to be over 4% annually. Given that the company has grown gross profit with a CAGR of 10% over the last five years, that the loyalty industry is growing at a double digit rate as a whole, and that management has guided for faster growth in the years to come, a long-term growth rate of over 4% seems very doable.
The long term financial goals are gross profit in the high-90 MUSD range by the end of 2022, accompanied by an adjusted EBITDA in the mid-40 MUSD range. To achieve this, gross profit needs to grow at a CAGR of around 15%, and adjusted EBITDA needs to grow at 25-30% annually. So the gross profit needs to grow faster than it has been for the last couple of years (10% CAGR over the last five years), adjusted EBITDA needs to grow even faster (16% CAGR over the last five years), indicating that management expects considerable operating leverage working in a positive direction going forward. Indeed, the company targets an “effective margin”, defined as adjusted EBITDA / Gross profit of 45% in 2022. The 3 and 5-year average “effective margin” are both 30%. These are, in my opinion, quite aggressive targets, and I would not like to depend on them for an investment to be profitable, but let´s pretend for a second that management is spot on and that we end 2022 with an adjusted EBITDA of 45 MUSD. EBITDA would be more like 40 MUSD, and if we slap a generic 8 times EBITDA multiple on that (if the company would reach these ambitious goals the real multiple will likely be quite a bit higher, but let’s be really conservative), we get a value of 320 MUSD (and remember, FCF is likely to be at least the same as EBITDA or higher). Comparing this to today’s 199M market cap we get a CAGR of 17% in capital gain. If we assume that the company keeps reducing the share count with 3% a year, you´re looking at an annual return of 20%, not counting any cash that has piled up on the balance sheet or potential dividend. If management meets the long term financial goals, the stock is very cheap. To make a market beating return of 10-12% a year, the company can miss the long term financial goals by some margin provided an average market multiple to EBITDA or cash flows.
I can see how this is not a particularly exciting stock to own for a lot of people. The business is pretty boring and niche, there´s no catalyst, and it is not incredibly cheap. I just think it is a very nice and solid business that is being overlooked and undervalued due to it being small and fairly illiquid.
RISKS
With a large exposure to travelling in general and airlines in particular, a downturn in the economy would likely be negative for the business, and any event that has an adverse effect on how much people fly would likely be very negative as well. Carbon emissions are certainly a real thing, and if the environmental movement will gain traction worldwide and make people fly less, that could pose a long term risk. This has certainly happened to some extent in Sweden with “flight shame” actually becoming a thing in 2019, and was probably one of the reasons that the number of passengers who flew through Swedish airports decreased 4% YoY. A terrorist attack including planes is also very likely to make people fly less, at least for some time.
Customer concentration is also a risk. The top three partners make up 70% of revenue, but as discussed earlier, revenue is a bit misleading due to how it is booked. Management does not disclose how much these three partners contribute to gross profit, but 80% of gross profit comes from 14 different partners, at least indicating that gross profit is a bit more spread out over several partners. Still, it would be nice to get a number on how much the three largest partners contribute to gross profit to further evaluate the customer concentration risk.
I can´t help but feel that management is a bit of a risk as well. To be clear, there really isn´t anything in the way the business has been run to cause any concern at all as far as I can tell, but the combination of a very bullish outlook for the company, combined with very low insider ownership makes me cringe a little. It is very possible that management is overly optimistic with their long term financial goals, we have no history of them making these type of long term forecasts to compare with, so I really do not want to rely on these goals to make a market beating return on my investment. This is why I´m being very conservative in my valuations and future growth prospects of the business. I am also going to be weary of any acquisitions going forward. The existence of the float that funds the company is crucial to my investment, and any move on managements part that would eliminate the float would be an immediate sell decision for me.
Then there is the very significant risk of me misjudging things. I might be underestimating the level of competition in the LCR segment going forward. The lack of historical competition is in no way a guarantee of low competition in the future, neither is company commentary on the subject. I might also overestimate how predictable and safe the business really is. The development since 2008 has been outstanding, but so has the economy as a whole, and the company has certainly been riding a secular tail wind with the overall loyalty market growing faster than the economy. There really is no telling how the company will do in a shakier general economic environment.
FINAL NOTES
I am very grateful for the feedback I received on my post mortem-post on Aspire Global. Thank you all who contributed! I welcome any critique or feedback on this post as well, both regarding the way it is written, but more importantly, the actual analysis of the business and its valuation.
Disclaimer: The information provided in this post is not to be considered as any form of investment advice. I might buy or sell shares in any companies discussed in the post without notifying readers of the blog. I currently do not own shares in Aspire Global.
I recently sold all my shares in Aspire Global. The company is active in the ”iGaming”-industry, or to put it more bluntly, online gambling-industry. It was founded in 2005 in Israel, but has been listed on the First North Growth Market in Stockholm since July 2017, while simultaneously being headquartered in Malta.
Aspires revenue is split into two segments, B2B and B2C. In the B2B segment, the company provides a complete platform for iGaming operators, taking care of every aspect of running the daily business except for driving traffic, which is left to the operator. If you wanted to start an online gambling site today providing casino, sports betting and bingo, reaching out to Aspire Global and slapping your brand on their platform is probably one of the easiest ways to get started. Most of the revenues in this segment comes from revenue sharing with the operators. In the B2C segment they have their own brand, Karamba, directly facing consumers.
As was the case with most stocks I bought during the time around which I bought Aspire, I did not do enough research on the company, as I just didn´t spend that much time managing the portfolio. The thesis was quite simple though: the entire gambling sector in Sweden was trading at low multiples due to the new legislation that was put into effect at the start of 2019 that requires licenses for all operators and put serious limitations on what kind of advertising and bonus schemes the sites can run. Aspire, with very limited exposure to the Swedish market, was the cheapest of them all (or at least the ones I considered), despite growing revenues at a very high pace (45% YoY Growth in revenues 2017 -> 2018). I fet like the gambling sector as a whole, and Aspire in particular, was just temporarily out of favor and way to cheap.
Over the course of 2019, the stock has performed very badly dropping around 40% to a point where it now trades somewhere between 6-7 times earnings, while total revenue is probably going to have grown somewhere along the lines of 30% in 2019. On the face of it, this seems incredibly cheap (and it might very well be), so why the heck am I selling?
There are several reasons. One is that the business doesn´t seem to be scaling well. While I expect the company to report annual revenue increase of around 30% YoY in their upcoming annual report, EBIT and EBITDA numbers for 2019 will probably be up more like 10%. Margins are down across the board. If we zoom in on the B2B segment, on the face of it, things seems to be going fine with revenues likely to be up something like 45% YoY, and EBITDA up around 35% YoY. Pretty massive numbers, but also a pretty big divide between increases in revenue and EBITDA. This confuses me quite a little, as I would expect margins to actually increase the more this segment grows. Regardless of whether the growth comes from old partners increasing revenue or signing new ones (they did sign quite a few over the last couple of years), this should improve margins as a lot of the costs (overhead, technology etc) should remain fairly flat. If we combine this with the fact that ”Distrubtion expenses”, the post on the income statement that contains royalties paid to operators, has gone from 56% of revenue in 2015, to 63% in 2018, to 68% in Q1-Q3 2019, it seems like Aspire is gaining new business by offering better terms to potential new operators and keeping a lower share of revenus themselves, rather than by providing a superior product. This has also been implied in the comments made by the company, where they claim that they are ”offering operators incentives to grow”, which again, seems weird to me. Operators should have all the reason in the world grow, regardless of their cut on the revenue.
Aspires own B2C-segment has done poorly in 2019. Revenues are likely going to be up by a few percent, whereas EBITDA is likely to be around 35% lower in 2019 than 2018 by my estimates. According to the company this is due to higher marketing expenditure and temporarily low activity in the UK and Netherlands. Maybe this is just a temporary blip, but I can´t seem to fight this feeling that this might happen to several of Aspires clients over time.
To expand on that, Aspire mainly caters to smaller, less known operators. Compared to most other operators, Aspire is a little bit different in that they have managed to have a higher Hold% over time, meaning that for every dollar of net gaming revenue, they have paid less back to the players and kept more to themselves and their partners. They also have a lower retention rate than the sector average. As markets gets regulated and the ability to advertise freely and use bonus schemes to retain players might be compromised, it seems likely to me that brand awareness and customer satisfaction will be of increasing importance. Aspire and their operators generally scores poorly on both. Over the next couple of years, I think it´s likely that we´ll see considerable consolidation in the sector, where large operators gets even bigger and the smaller ones get even smaller, to a point where they might even disappear. Since none of Aspires operators are big ”premium” operators, I think this development is likely to be negative for Aspire. Even if an operator using Aspire gets acquired by a larger operator, it is likely that Aspire will loose this business.
Obviously, if Aspire would keep growing at the current rate and it´s earnings would follow along, it is a screaming buy at this valuation. However, I do have some concerns regarding the sustainability of their growth. From 2015-2017, the company didn´t grow nearly as fast. Revenus grew 1% in 2016 and 8% in 2017, before taking off in 2018 growing 45%, and by my estimates will grow close to 30% in 2019. This is probably very closely tied to the fact that during 2017, the company signed 15 new partnerships and launched 22 new brands (the same partner might have several brands), and followed this up by signing another 8 partners and launching 13 brands in 2018. In 2019, the company has added a net of 4 brands, making the total amount of brands somewhere above 65 spread across 45 partners. Since there is usually a lag from the time of signing a new partnership to recognizing any significant revenue, the deals struck in 2017-2018 seems to have been the major growth driver in revenue for 2018-2019, and the addition of new partnerships seems to have slowed down quite a bit in 2019. As the market is only so big, and there are only so many operators, it seems hard for Aspire to grow nearly as fast in the same markets going forward by adding new operators. Instead, to grow in these markets, they are going to have to grow either by increasing revenue from proprietary and partner brands, or by increasing margins, and as I expanded on earlier, I am not particularly optimistic about either of those things happening, though I might very well be wrong. On the flip side, they are looking to enter markets outside the EU, have signed a deal with 888 to enter the U.S. in New Jersey, and recently acquired gaming aggregator Pariplay in what looks to be a promising deal that should increase revenue with 5-10% in 2020 at higer margins than the core business. It´s not like the company is going to stop growing its revenue completely, but I struggle to make any sort of prediction with a reasonable degree of confidence as to the pace of future growth, and the margins attached to it. It should also be noted that at 7 times earnings growth might not be necessary to justify the price, but the combination of slower growth and potentially lower margins in the future isn´t very appealing.
Finally, the company does seem to end up in disputes with authorities more often than the competitors I follow. During 2019 they were fined twice by the Swedish gambling regulator, the first one relating to a failure to connect with the self-exclusion database Spelpaus, and the second one for breaking bonus rules. They have also been sued by the Swedish Consumer Agency who claims that Aspire Globals proprietary brand Karamba are violating the gambling act when it comes to moderation and use of bonuses and free spins as a marketing tool (Aspire is disputing this claim). To round of the year, the company announced on New Year´s Eve that it had reached a settlement with the Isreali Tax Authority that will have Aspire pay 13.7M€ over tax issues for the fiscal years 2008-2018, effectively wiping out the entire profit for the 2019 fiscal year. The peculiar timing of this announcement does nothing to enhance my faith in company management. As a side note, the cash raised from a bond issuance in 2018 that has inexplicably been sitting on the balance sheet for well over a year now, will now be put to use paying of the settlement.
SUMMARY
To summarize, the main reasons I sold out of Aspire Global are:
The business model doesn´t seem to be scaling the way I expected it to.
I don´t believe management commentary on why this is.
I am uncertain of the long-term durability of the business model when markets gets regulated and stronger brands likely will be favored. This makes it hard for me to predict the future with any kind of confidence.
Growth in revenue will likely slow, and margins are already declining so earnings growth might taper off substantially.
Lawsuits and disputes with tax authorities combined with a very weird timing of the latest announcement has led me to question the cander of management.
To be clear, it is the combination of the reasons listed above that made me sell out. Had I only held one or two of these concerns, I would have likely kept the stock at its current valuation. There are certainly things I like about Aspire. It´s a consistently profitable capital light business that used to have net cash (before the tax settlement), and by owning Aspire you get some diversification on the operator level compared to owning a single operator. I am trying to dodge a value trap here, but I have to admit that I´m not certain at all that the stock isn´t severely undervalued still, but I just don´t feel confident enough about the company quality and future outlook to bet on it at the moment. I will continue to monitor the company, and should any of my above concerns be settled, I might find myself owning it once again, as I am very attracted to the valuation (normalized for the one-time tax expense).
Lastly, I would like to touch on potential biases affecting my decision to sell. The stock has been doing incredibly poor since I bought it, so there is a risk that I might be overly negative about the future of the company as a consequence of this, rather than relying on what the financials looks like today. It is also possible that I am reading way too much into comments made by management and the timing of the announcement regarding the tax dispute. Biases are very hard to protect against, so it´s very hard for me judge whether I´m biased in my assumptions here or not (ask me again in a year and I will probably have a better idea of whether I was biased in this decision or not), but I did not sell in panic or anything like that. I have pondered the case for a long time, and spoken to several of my investing friends that are very knowledgeable in this sector, and they largely agree with my conclusion. I was leaning towards sell but was taking the holidays to decide, and then the weird announcement regarding the tax dispute happened, which was just enough to push me over the edge.
As always, any feedback on my reasoning and analysis is greatly appreciated!
There are clearly numerous ways to make money in investing. There are successful growth investors, momentum investors, value investors, buy and hold-investors etc. For me to succeed as an investor, I think it is very important to find the style of investing that suits me personally, a style that I feel comfortable enough with that I can confidently execute it over the long term, even when the markets seem to disagree with me and my valuations.
My investment philosophy is still very much a work in progress. Because of that, this post might not be perfectly coherent and structured, instead it will contain som random thoughts on how I think about stocks/businesses, and what businesses I even care to look at, for the time being. This post is not only meant to provide my ENOURMOUS following with an understanding of my investment mindset, it is just as much a way for me to clarify my thoughts and make sure they make sense by putting them into print. All of this is highly subject to change in the future as I grow more competent, confident and evolve as an investor, and as always, any feedback is greatly appreciated!
As I mentioned in my previous post, I have read a bunch of books on value investing over the years. The idea of buying something for less than what it is worth is very logical to me, and is central to the way I think about stocks. As such, I will not buy a stock solely because I think someone else might be willing to pay me more for it in the short term for some reason that is not rooted in company fundamentals. However, I don´t really want to label myself as strictly a value investor, as I don´t want to slap a label on myself that might (consciously or unconsciously) prevent me from exploring ideas that might not be considered traditional value cases. I want to be open to all kinds of ideas that I can wrap my head around, and take whatever spots I deem to have the highest expected value. For the time being though, the caveat of me being able to truly understand the situation is a pretty big one in most industries, and I will likely stick to fairly straight forward situations in companies that are relatively easy to understand.
Being a data analyst and a huge fan of the work of Daniel Kahneman and the behavioural economics field as a whole, I want my investment strategy to be evidence based. Even though the knowledge of certain biases doesn´t seem to eliminate said biases, I have made a point out of asking myself before buying any stock, what different biases might be affecting me in my evaluation of the company, and how. The notion of an outside view (how do companies such as this generally perform over time) as well as an inside view (how will this particular company perform over time given its idiosyncratic characteristics) is also critical in how I think about the future prospects of a company. I suspect that the overall tendency of many market participants is to focus a bit too much on the inside view, as this is what is most natural for us as human beings, though I also suspect that in some industries, people aren´t focusing enough on the inside view, but instead treat all companies as pretty much the same when in fact, they are not.
Being evidence based, I am also very careful about extrapolating massive growth, particularly profitable growth, far into the future. As shown by Michael J. Mauboussin in his paper ”Death, Taxes and Reversion to the Mean” (and in several other studies), the ROIC for most (not all) companies tend to revert towards the mean over time. It is also shown that forecasts as a whole are generally too positive. These are in my opinion, things to be wary of when valuing a company. It doesn´t mean that I don´t like growth, on the contrary, profitable growth is great and a vital component of any valuation of a company. I am just not very comfortable assuming large growth numbers at a huge profit for a particularly long period of time, unless I am very confident that a company has a huge moat that it will be able to capitalize on for a long period of time and as such, belongs to the roughly 4% of companies that Mauboussin found doesn´t seem to suffer from mean reverting returns on invested capital. I did read Microeconomics 101, after all 🙂
Given that I am in the relatively early stages of my development as an investor, I don´t think there are many industries in which I am better than the next guy (or more importantly, the market as a whole) at judging what companies will enjoy sustainable high ROIC:s over time and as a consequence of that, I am rarely going to be paying high multiples for any of the stocks I buy if that means I have to assume fast paced growth many years in to the future, which it usually does. Given that regression to the mean also works for companies that are currently doing very poorly, a very good case could be made that it would be best for me to focus on these businesses instead, trying to find companies that currently have poor returns that I expect to regress upwards towards the mean in the future. This strategy is more of a deep value strategy, similar to the one being executed by Tobias Carlisle who also makes the podcast ”The Acquirers Podcast” that I greatly enjoy.
That is not the path I have chosen. The reason is mainly a psychological one. Even though there is ample evidence that such a strategy is likely to outperform the overall market if you use the right metrics (at least it was in the past), I don´t think I would execute it very well. I don´t trust myself to be able to hold on to really iffy looking companies when the times get rough, and I don´t really think I would be very good at knowing when to dispose of companies that really are going to sh*t and when to hold on to companies that are actually turning the ship around. In short, I don´t trust myself to be mechanic enough to just hold on to companies that look terrible even if the strategy insists I should, and I don´t think I´m good enough at deciding which terrible looking company is going to turn good, and which one is heading for bankruptcy.
Instead I have chosen to try and find good, or preferably great, companies that for some reason are trading cheaply. Ideally, I´d like a non-cyclical business with predictable earnings and cash flows, a high amount of recurring revenue, low debt, great management that has significant skin in the game and a wide moat surrounding the business. Sounds familiar? Well, that´s probably because more or less every investor out there inspired by Warren Buffett is looking for exactly that, and as a consequence, those companies are rarely cheap. To try and uncover a few hidden gems, I rarely look at closely followed large caps or the companies that everyone is talking about. Instead I mostly focus on small/micro caps, spin offs, illiquid stocks or other situations that for some reason hide the actual quality of the underlying business. The reasoning is simple, I just feel like the probability of a mispricing occurring should be much greater in companies that are operating in these areas of the market and that have less analysts following them. Again, I don´t want to limit myself by imposing strict rules on what I can and can not do, so if a gigantic company for some reason would become very undervalued in my opinion, I will definitely be open to investing in that area as well, but since there are way more companies out there than I have time to analyze, for the most part I won´t even be looking into huge companies unless I really feel that there is a very valid and realistic reason that the market to misvalue them. I do feel like the market tend to exaggerate and extrapolate both positive and negative news, which might make for interesting opportunities when the market decides that an entire sector is out of favor and drag all the companies in that sector down for a while.
I laid out some desirable characteristics for the businesses that I am most interested in a couple of paragraphs above. In reality though, there´s likely to be some compromising on my part with regards to these characteristics as it is incredibly hard to find businesses that tick every single box (especially for a low price), but I genereally look for businesses that I would deem as above average, selling at below average prices. I also focus quite a bit on downside protection. If I can identify situations where I think that the risk of actually losing a large chunk of my investment is very small, then most other outcomes are fine.
With that said, I am looking for investments where I expect to make at least 12% a year for at least five years, given conservative assumptions. If I dont´t expect to return more than the average market return, I should obviously just buy an index fund (but how fun would that be?!), and over time I hope to be able to move my goal up to making 15% a year. Given that I want to make 12% over at least five years, this naturally means that I want businesses where I can make some reasonable assumptions about what the business will look like in five years, or preferably longer than that. Generally I don´t expect to hold a stock for five years, but if I am right that the stock will return 12% a year over 5-10 years, either I will make those 12% a year and be fine with that, or the multiple will expand to a point where I no longer deem it undervalued and I sell off, likely making more than 12% a year (this reasoning is blatantly stolen from Geoff Gannon at https://focusedcompounding.com/ who also co-hosts my favourite investing podcast, Focused Compounding Podcast ). Obviously I will make mistakes and not every stock will return 12% a year, some will for sure have a negative return, but the hope is that some will yield a lot more than 12%, so that on average, obviously with a ton of variation along the way, I will make 12% a year.
No discussion on investment philosophy is complete without touching on diversification. Empirical studies show that diversifying beyond 30 stocks is sort of pointless as it doesn´t reduce volatility much, if at all. For me, having 30 would be rather unpractical as I do have a day job. Following 30 companies, plus all the companies I might be interested in adding to the portfolio would consume a lot of time, given that I want to know a lot about the companies I own. More importantly though, I struggle to see that the expected value of investing in the company that is my 30th favourite is even close to the EV of the company that is my favourite holding, or even my fifth favourite holding. I also think that I would struggle to find 30 companies that meet my strict investment criteria, that I also would feel like I understand enough to own long term. In the future, as I hopefully improve as an investor, I can see myself owning as few as 5-6 stocks, but right now I think that a portfolio of roughly 8-10 equally weighted stocks is a nice balance for me, hopefully not diluting my returns too much while simultaneously giving me some protection against my own ignorance and the inevitable mistakes I undoubtedly will make on occassion. The choice to concentrate also has to do with the type of businesses I´m looking at. If I had chosen the deep value approach touched on earlier, I would definitely be looking to have around 30 positions, but as my holdings will hopefully be of higher quality, more predictable and potentially a bit less volatile (at least on the downside), I´m hoping that 8-10 holdings spread out over a handful of sectors, hopefully not strongly correlated with each other, should provide enough diversification to reduce the risk of ruin to a very, very low number.
I am a 30+ years old Swedish guy who has finally decided to get serious about my investing. I have been invested in the stock market since 2011, and over the years I have made a couple of brief attempts at becoming a better investor, primarily by reading a ton of value investing books and following some blogs, but thats about as far as I´ve ever gotten. Instead, I have mostly been invested in index funds, and I have also had the great fortune to have a number of very talented friends that I occassionally has been able to discuss and copy some ideas from, with mininal work on my part. That I have outperformed the large Swedish indexes on aggregate since 2011 should pretty much be entirely credited said friends.
Over the past year or so, this has changed. I´ve been getting my hands dirty analyzing business, re-reading books and have been listening to a bunch of podcasts on investing, and really enjoyed it, and I finally feel like I´m getting a lot better at it (probably because I´m putting much more of an effort into actually understanding what I´m reading or listening to). I do have a bit of a manic side when it comes to learning new things, when I get interested in something, I want to everything there is to know about that specific topic, and right know I am in that phase where I spend pretty much all the time I can thinking about investing.
The main purpose of this blog is entirely selfish, namely for me to become a better investor. By putting my thoughts into writing I am forcing myself to really examine my process and make sure I do the work, and hopefully I will receive feedback from the investing community on whatever mistakes I make when analyzing businesses, as I am sure there will be plenty, while at the same time hopefully contributing with new interesting cases for other people to dig deeper into. I decided to write in English rather than Swedish, mainly because I didn´t want to limit myself to reaching only people that understand Swedish, which again ties into the fact that I am hoping for as much feedback as I can possibly get, from anyone who cares to provide it.
My day job is as a data analyst, where I run a two man consultancy business with a close friend of mine, and I have a degree in statistics. I also have a long history playing poker for a living. I expect both my day job and my history in poker to influence my investing style quite a bit, and I do think that my career in poker has helped me develop a mindset that has the potential to be a huge advantage in investing (I might elaborate on this in a future post).
This blog is certainly not meant to constitute investment advice, the posts may contain errors of different sorts, and as mentioned above, I would largely credit my friends for my investment record to date. Instead, I hope that the things I write can spark discussion and hopefully make all of us who engage better investors in the end.